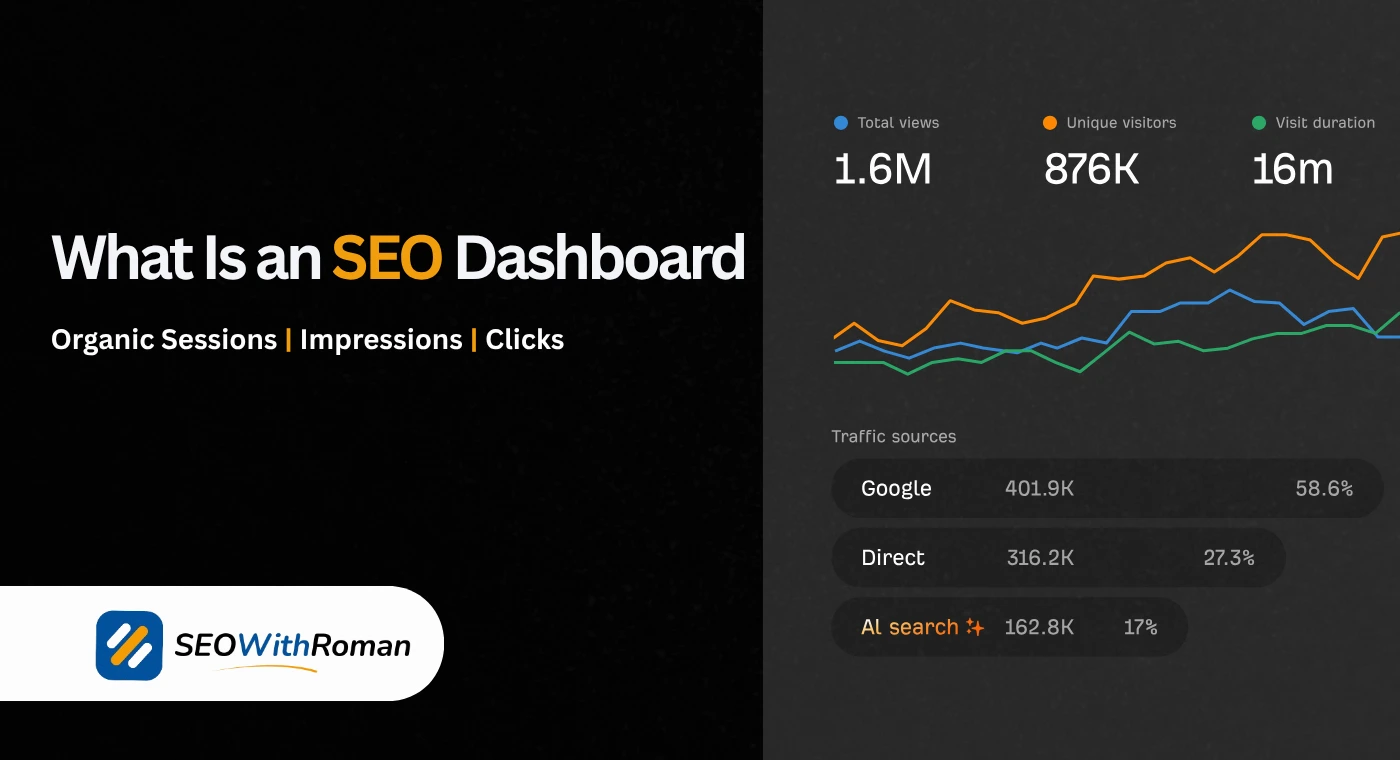
- An SEO dashboard is a single centralised view of all your most important SEO metrics, updated automatically in real time
- Without an SEO dashboard, you are making strategy decisions based on incomplete or outdated data
- The best SEO dashboards track organic traffic, keyword rankings, Core Web Vitals, backlinks, and conversion data in one place
- Google Looker Studio is the best free option for building a custom SEO dashboard without spending a single dollar
- Checking your SEO analytics dashboard weekly rather than monthly means you catch ranking drops days after they happen, not weeks
1 What Is an SEO Dashboard and Why Every Website Needs One
Most website owners check their Google Analytics once a month, notice something has changed, and have absolutely no idea when the change happened or why. By that point, a ranking drop that could have been fixed in a day has been sitting unaddressed for three to four weeks and the traffic loss has already compounded.
An SEO dashboard solves this problem completely
An SEO dashboard is a single, centralised view that pulls data from multiple sources including Google Search Console, Google Analytics, and your keyword tracking tool and displays the most important SEO metrics in one place, updated automatically. Instead of logging into three separate platforms and manually comparing numbers across different date ranges, you open one screen and see everything that matters at a glance.
In many years of managing SEO for B2B, CXM, and ecommerce clients simultaneously, the single biggest difference between clients who grew their organic traffic consistently and those who stagnated was not their content quality or their backlink strategy. It was how quickly they spotted problems and acted on them. An SEO performance dashboard is what makes that speed possible.
Think of it like the dashboard in your car. You do not need to stop the engine and open the bonnet every time you want to know if something is wrong. The dashboard tells you immediately. Your SEO reporting dashboard does exactly the same thing for your website.
2 How an SEO Dashboard Works | The Data Behind the View
Understanding how an SEO dashboard pulls and displays data helps you build a better one and interpret the numbers more accurately.
An SEO dashboard works by connecting to data sources through APIs, which are essentially automated pipelines that pull your data from platforms like Google Search Console, Google Analytics 4, Ahrefs, and SEMrush and feed it into a central display tool.
Here is how the data flow works in practice
Step 1: Data sources are connected. You authorise your dashboard tool to access your Google Search Console account, your GA4 property, and any other SEO tools you use. This is a one-time setup.
Step 2: Data is pulled automatically. The dashboard tool queries each data source on a schedule, pulling fresh data daily or in real time depending on the tool and plan you are using.
Step 3: Metrics are calculated and displayed. The raw data is processed into the metrics you care about, organic sessions, average ranking position, click through rate, Core Web Vitals scores, and displayed in charts, tables, and scorecards.
Step 4: You read the dashboard and make decisions. Instead of digging through raw reports, you see pre-calculated trends and anomalies that tell you immediately where your attention is needed.
The entire process after setup is fully automated. You build it once and it updates itself every day.
3 The 10 Most Important SEO Metrics Every Dashboard Must Track
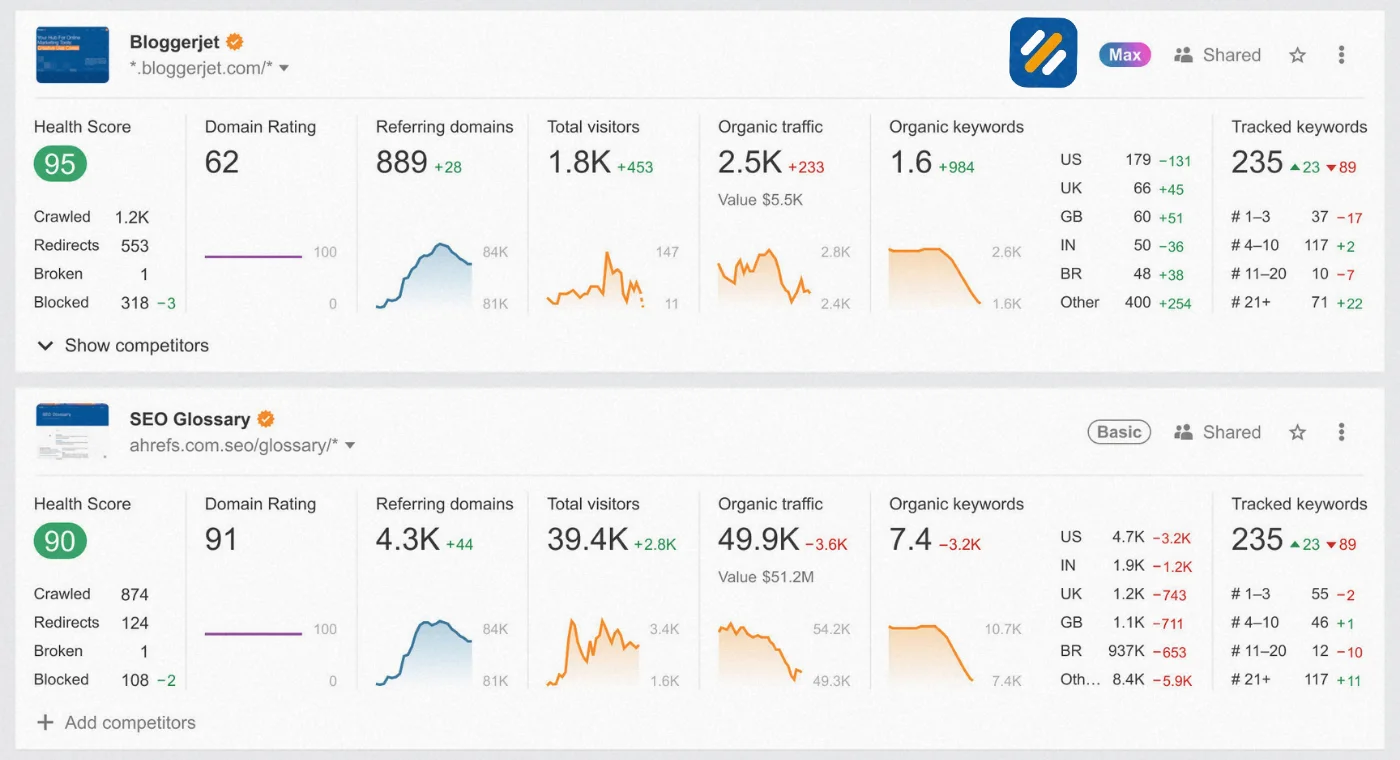
Not every metric belongs on an SEO dashboard. The goal of a good SEO analytics dashboard is to show you what matters most at a glance, not to overwhelm you with every data point your tools can produce.
After years of building dashboards for clients across multiple industries, these are the ten metrics that consistently drive the most useful decisions
| SEO Metric | What It Tells You | Data Source | How Often to Check |
|---|---|---|---|
| Organic sessions | How many visitors arrived from unpaid Google search | Google Analytics 4 | Weekly |
| Average keyword position | Where your pages rank on average across all tracked keywords | Google Search Console | Weekly |
| Click through rate | Percentage of searchers who click your result after seeing it | Google Search Console | Weekly |
| Total impressions | How many times your pages appeared in Google search results | Google Search Console | Weekly |
| Core Web Vitals scores | Page experience metrics Google uses as a ranking signal | Google Search Console | Monthly |
| Keyword ranking changes | Which keywords moved up or down in position this week | Ahrefs or SEMrush | Weekly |
| Backlink count and quality | Number and authority of websites linking to your domain | Ahrefs or Google Search Console | Monthly |
| Top landing pages by organic traffic | Which pages are driving the most search visitors | Google Analytics 4 | Weekly |
| Organic conversion rate | Percentage of organic visitors completing a goal | Google Analytics 4 | Monthly |
| Crawl errors and 404s | Technical issues preventing Google from indexing your pages | Google Search Console | Weekly |
4 Types of SEO Dashboards | Which One Do You Actually Need
Not every SEO dashboard serves the same purpose. Choosing the right type for your situation saves you hours of setup time and gives you more relevant data from day one.
SEO Performance Dashboard
This is the most common type. It gives you a high-level overview of your website's organic search health. Organic traffic trends, average position, impressions, and click through rate all sit in one view. This is the dashboard a website owner checks every Monday morning to see how last week went.
Keyword Ranking Dashboard
This dashboard focuses specifically on how your tracked keywords are moving over time. It shows position changes, tracks whether target keywords are moving toward page one, and flags sudden drops that need investigation. Essential for content-heavy blogs and SEO campaigns with specific keyword targets.
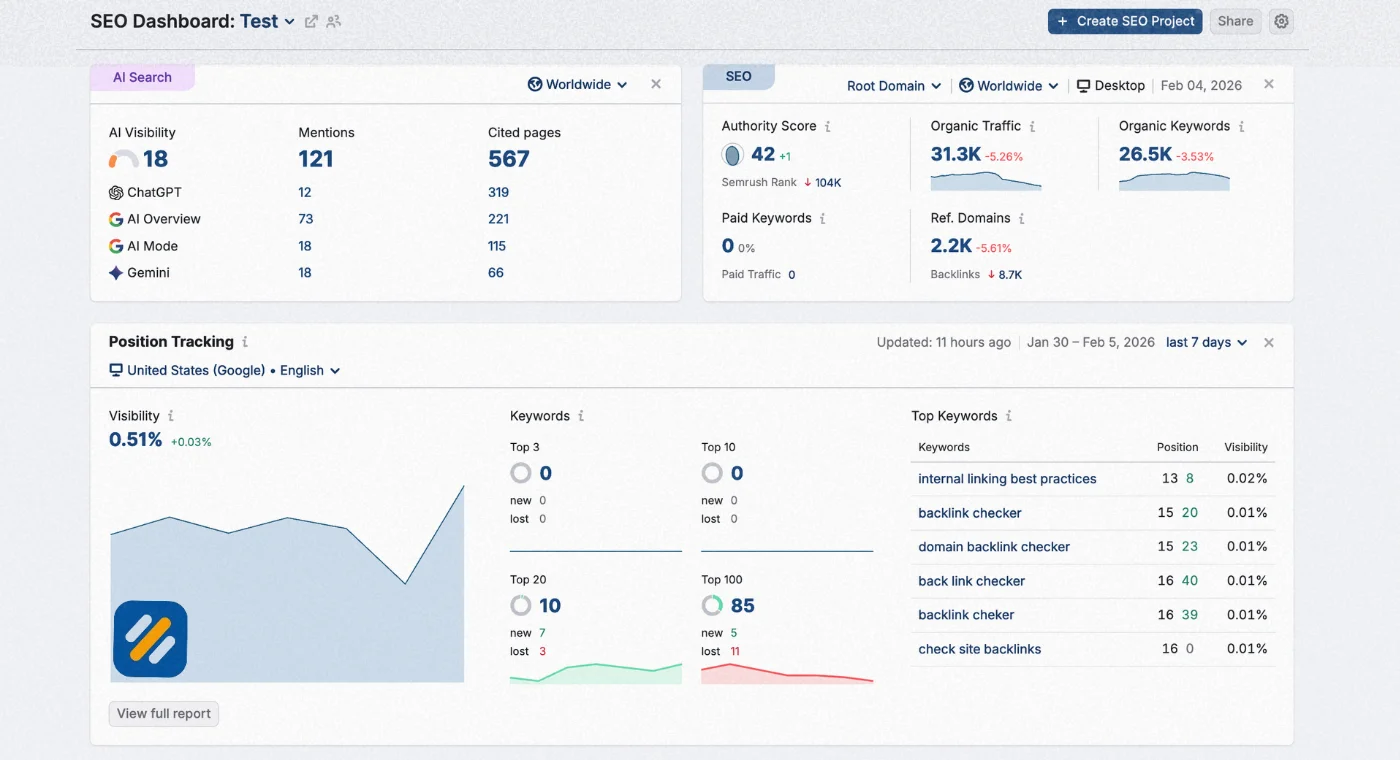
SEO Reporting Dashboard
Built for agencies and consultants who need to present SEO results to clients. This dashboard is designed to look clean and professional, with branded elements, clear trend charts, and a narrative structure that makes results easy to understand for non-technical audiences.
Technical SEO Dashboard
Focused entirely on website health. Crawl errors, 404 pages, page speed scores, Core Web Vitals, mobile usability issues, and indexing problems all live here. This is the dashboard a developer or technical SEO specialist checks to ensure the website foundation is always clean.
Local SEO Dashboard
Combines Google Business Profile data with Search Console and GA4 to track local search performance. Shows map pack rankings, direction requests, phone calls from Google, and local keyword traffic. Built specifically for businesses serving a geographic area.
5 Best Free and Paid SEO Dashboard Tools in 2026
| Tool | Cost | Best For | Data Sources Supported | Skill Level Needed |
|---|---|---|---|---|
| Google Looker Studio | Free | Custom dashboards, agency reporting | GA4, GSC, Google Ads, Sheets | Beginner to intermediate |
| Google Search Console | Free | Core SEO performance, indexing data | Direct from Google | Beginner |
| Ahrefs Dashboard | Paid from $129/month | Keyword tracking, backlink monitoring | Ahrefs database | Intermediate |
| SEMrush | Paid from $139/month | All-in-one SEO reporting and auditing | SEMrush database, GA4, GSC | Intermediate |
| Rank Math SEO (WordPress) | Free and Pro | On-page SEO tracking within WordPress | WordPress, GSC integration | Beginner |
| Geckoboard | Paid from $39/month | Real-time TV dashboards for teams | GA4, Google Sheets, Hubspot | Intermediate |
| Klipfolio | Paid from $99/month | KPI dashboards, custom metrics | 100+ data source connectors | Intermediate to advanced |
| Looker Studio with Databloo | Free templates available | Ready-made SEO dashboard templates | GSC, GA4, Ahrefs, SEMrush | Beginner |
For a small business or personal blog just starting out, Google Looker Studio connected to Google Search Console and GA4 gives you a professional, real-time SEO dashboard at zero cost. That is the combination I recommend before spending a single dollar on paid tools.
6 How to Build a Free Custom SEO Dashboard in Google Looker Studio
Google Looker Studio is the best free tool available for building a custom SEO dashboard. It connects directly to Google Search Console and Google Analytics 4, updates automatically, and produces professional-looking reports you can share with anyone via a link.
Here is the exact process to build your first SEO dashboard in under one hour
Step 1: Go to lookerstudio.google.com and sign in with your Google account. Click Blank Report to start a new dashboard from scratch, or search "SEO dashboard template" in the Template Gallery to start from a pre-built layout.
Step 2: Connect your data sources. Click Add Data in the top menu. Select Google Search Console and connect your verified property. Then add a second data source for Google Analytics 4 and select your GA4 property. Both connections are free and authorised with one click.
Step 3: Build your core metrics section. Add Scorecard widgets for your four most important headline numbers: total organic clicks, total impressions, average CTR, and average position. These give you an immediate health check every time you open the dashboard.
Step 4: Add a trend line chart for organic traffic. Insert a Line Chart, set the data source to GA4, set the dimension to Date and the metric to Sessions filtered to Organic traffic only. Set the date range to Last 90 Days. This shows you the traffic trend at a glance.
Step 5: Add a keyword performance table. Insert a Table widget connected to Google Search Console. Set dimensions to Query and metrics to Clicks, Impressions, CTR, and Position. Sort by Clicks descending. This shows your top performing keywords immediately.
Step 6: Add a top landing pages section. Insert another Table connected to GA4. Set dimension to Landing Page and metric to Organic Sessions. This shows you which pages are driving the most search traffic.
Step 7: Set your date range controls. Add a Date Range Control widget so you can switch between Last 7 Days, Last 28 Days, and Last 90 Days with one click. This makes the dashboard useful for both quick weekly checks and deeper monthly reviews.
Step 8: Share your dashboard. Click the Share button and set the link to Anyone with the link can view. Send this link to your client or bookmark it yourself for your weekly check.
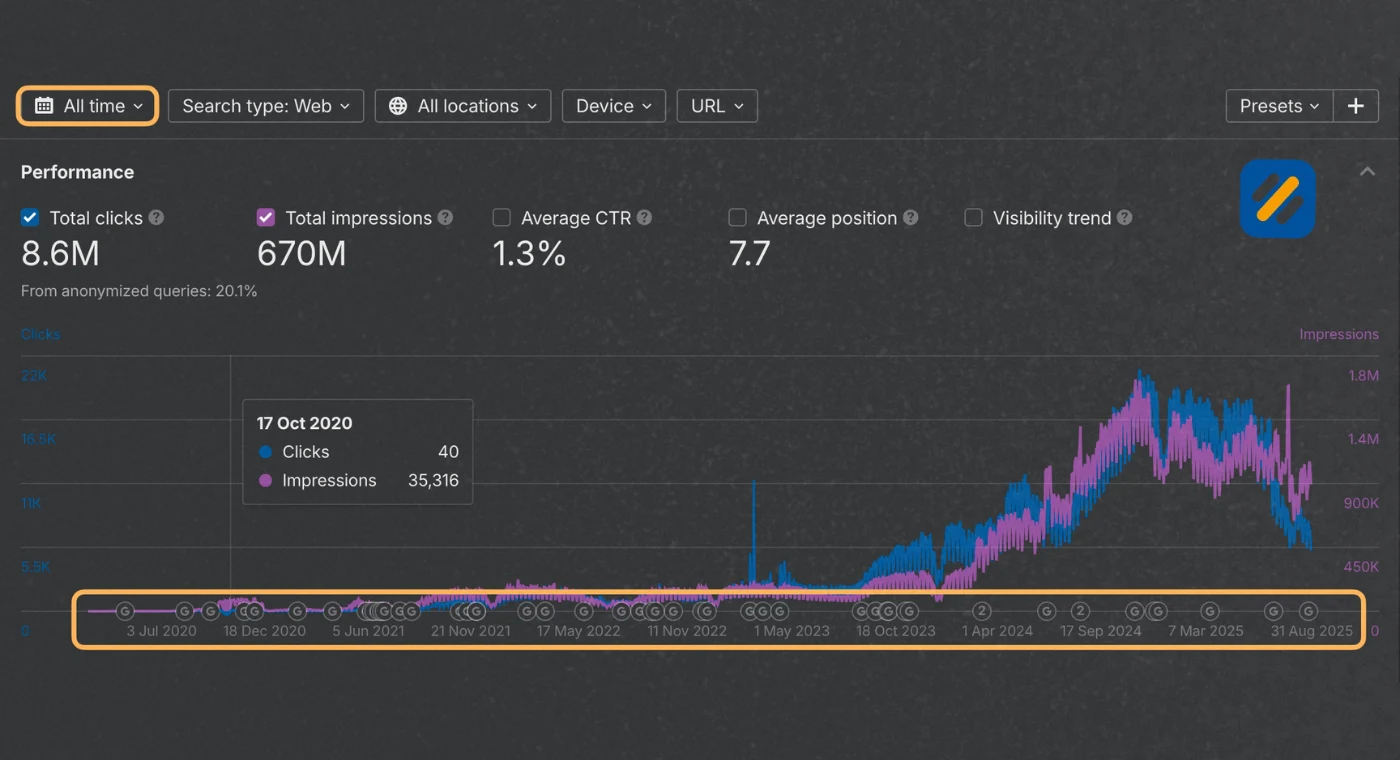
7 SEO KPI Dashboard | The Metrics That Actually Move Business Decisions
An SEO KPI dashboard is different from a general performance dashboard. KPIs, key performance indicators, are the specific metrics tied directly to business goals rather than just SEO activity.
Most SEO dashboards show activity metrics. KPI dashboards show outcome metrics. Here is the difference:
| Activity Metric | KPI Equivalent | Why the KPI Matters More |
|---|---|---|
| Total organic sessions | Organic sessions from target audience country | Traffic from the wrong country does not convert |
| Average keyword position | Number of keywords ranking in top 3 positions | Position 1 to 3 gets 60% of all clicks |
| Total backlinks | Backlinks from domain authority 40 and above | Low quality links add noise without value |
| Articles published | Articles ranking on page one | Publishing without ranking is wasted effort |
| Impressions | Click through rate on impressions | High impressions with low CTR signals a title tag problem |
| Bounce rate | Organic conversion rate | Engagement without conversion does not grow revenue |
When you build your SEO KPI dashboard, choose metrics that directly answer the question: is our SEO generating business results? Not just traffic, but qualified traffic that leads to enquiries, sign-ups, or purchases.
8 3 Expert Tips to Get More From Your SEO Dashboard
Tip 1: Set a fixed weekly review time and stick to it.
The most valuable thing about an SEO dashboard is not the data it shows. It is the habit of reviewing it consistently. Set a recurring 15-minute slot every Monday morning to check your dashboard. Ranking drops spotted on Monday get fixed by Wednesday. Ranking drops spotted in a monthly review have already cost you four weeks of traffic.
Tip 2: Add a comparison period to every metric.
Never look at a metric in isolation. A dashboard showing 2,400 organic sessions this week means nothing without context. Configure every metric widget to show a comparison to the same period last week or last month. The percentage change is what tells you whether to celebrate or investigate.
Tip 3: Build separate dashboards for different audiences.
Your weekly operational dashboard should be dense with data. The dashboard you share with a client or a non-technical business owner should show three to five numbers maximum with clear trend arrows. Build two versions from the same data sources. One for you to manage SEO with, one for stakeholders to understand performance at a glance.
9 Conclusion
An SEO dashboard is not a luxury for large teams or enterprise brands. It is the most practical tool any website owner can set up to stop flying blind on their organic search performance.
Google gives you everything you need for free. Search Console, Analytics 4, and Looker Studio together give you a real-time SEO reporting dashboard that updates itself daily, shows you exactly which pages and keywords are performing, and flags problems before they cost you months of traffic.
Set it up once. Review it every Monday. Act on what it shows you.
That single habit will give your SEO strategy more direction and speed than any tool, technique, or tactic you could add on top of it.
Have a question about setting up your first SEO dashboard? Drop a comment below and I will walk you through it personally.
Join 1,000+ business owners and bloggers who get one actionable SEO tip every week — straight to their inbox. Free forever.
Get Free Weekly Tips →