- Google Analytics 4 is a free web analytics tool that shows you exactly how visitors find, use, and leave your website
- GA4 replaced Universal Analytics in July 2023 and uses an event-based tracking model instead of session-based tracking
- GA4 is completely free to use and connects directly with Google Search Console, Google Ads, and other Google products
- The GA4 dashboard shows you traffic sources, user behaviour, engagement rates, conversions, and real-time visitor data all in one place
- For SEO, GA4 is most powerful when connected to Google Search Console, giving you keyword data alongside on-site behaviour data
1 What Is Google Analytics and Why Every Website Owner Needs It
Imagine running a physical shop with no way to know how many people walked in, where they came from, which products they looked at, or why they left without buying anything. That is exactly what owning a website without Google Analytics feels like.
Google Analytics is a free web analytics platform created by Google that tracks and reports on how people find and interact with your website. It tells you where your visitors come from, what pages they read, how long they stay, what actions they take, and where they drop off.
The current version is Google Analytics 4, commonly called GA4. It was officially released in October 2020 and became the default analytics platform in July 2023 when Google permanently shut down Universal Analytics, its predecessor.
In many years of doing SEO for clients across multiple industries, I have never worked on a website without Google Analytics connected. It is not optional if you want to make decisions based on evidence rather than guesswork. Every strategy improvement, every content decision, and every traffic source comparison starts with the data inside GA4.
The most important thing to know upfront is that Google Analytics is completely free. You do not need a paid subscription to access any of the core features that most small business owners and bloggers will ever need.
2 What Data Does Google Analytics Give You | And What Can You Do With It
This is the question most beginners should ask before setting up any analytics tool. Not how it works technically, but what decisions it actually helps you make.
Here is what GA4 shows you and the real-world use for each data type
| Data Type | What GA4 Shows You | How You Use It |
|---|---|---|
| Traffic sources | Organic search, direct, social, referral, paid | Understand which channels are growing and which are declining |
| User behaviour | Pages visited, scroll depth, time on page, clicks | Identify which content keeps visitors engaged and which loses them |
| Audience data | Location, device type, new vs returning users | Tailor content and campaigns to your actual audience profile |
| Conversions | Form submissions, purchases, button clicks, downloads | Measure which pages and traffic sources drive real business outcomes |
| Real-time data | Active users right now, their location and current page | Monitor campaign launches, new article traffic, or live events |
| Landing pages | Which pages users first land on from each traffic source | Identify your strongest entry points and optimise weak ones |
| Engagement rate | Percentage of sessions with meaningful interaction | Replace bounce rate with a more accurate picture of content quality |
| Search Console data | Keywords driving clicks, impressions, CTR, average position | Combine keyword performance with on-site behaviour in one place |
Every piece of data in this table answers a specific business question. The goal of using Google Analytics is not to collect data. It is to answer questions that help you make better decisions faster.
3 Google Analytics vs Google Analytics 4 | Understanding the Real Difference
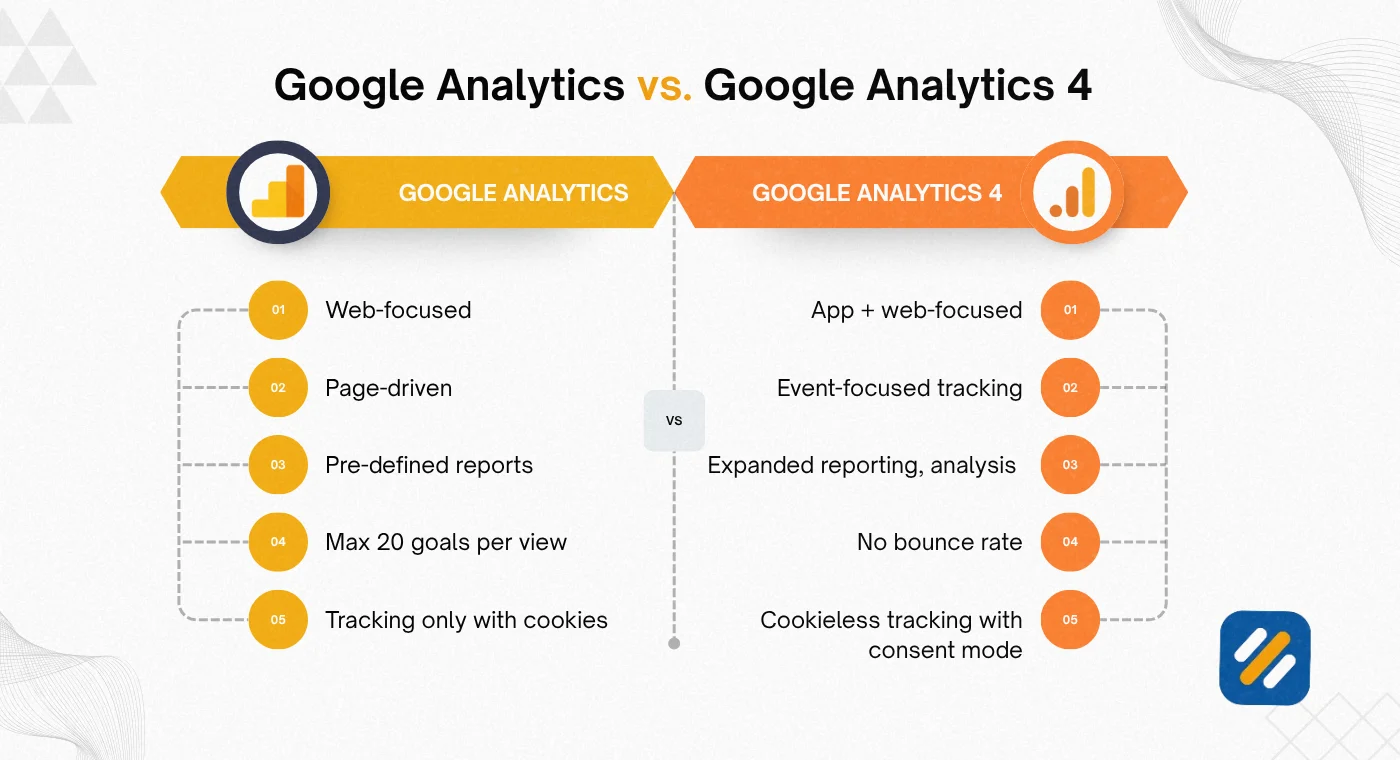
If you used Google Analytics before July 2023, you were using Universal Analytics (UA). GA4 is not an upgrade to the same system. It is a fundamentally different product built on a completely different data model.
Understanding the difference matters because the two platforms measure things differently, which means comparing old UA data to GA4 data directly is not reliable.
The core difference is how they track user behaviour
Universal Analytics was session-based. It grouped all actions a user took within a time window into one session and reported on sessions and pageviews as the primary metrics.
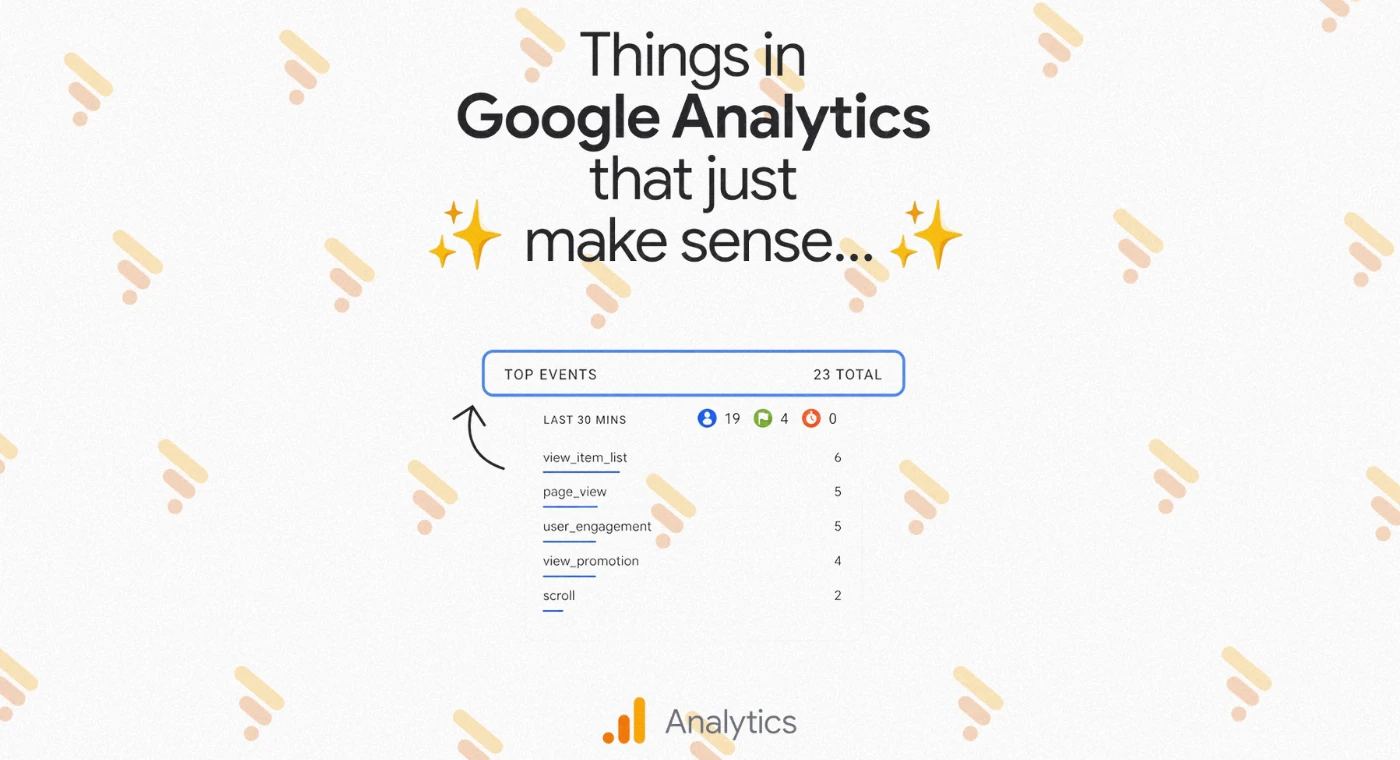
GA4 is event-based. Every single interaction a user has with your website is recorded as an individual event. A page view is an event. A scroll is an event. A video play is an event. A button click is an event. This gives you a far more granular and accurate picture of what users actually do.
| Feature | Universal Analytics | Google Analytics 4 |
|---|---|---|
| Data model | Session-based | Event-based |
| Primary metrics | Sessions, pageviews, bounce rate | Engagement rate, events, conversions |
| Cross-device tracking | Limited, users on different devices counted separately | Native cross-device tracking with unified user ID |
| Privacy compliance | Cookie-dependent, increasingly problematic | Built for a cookieless future with privacy controls |
| App tracking | Required a separate Firebase property | Web and app data unified in one property |
| Machine learning | Minimal | Built-in AI predictions and anomaly detection |
| Conversion setup | Required manual goal configuration | Any event can be marked as a conversion in seconds |
| Free data retention | Up to 14 months | Default 2 months, extendable to 14 months in settings |
| Reporting | Standard predefined reports | Fully customisable exploration reports |
| Status | Permanently shut down July 2023 | Current active version |
The most practical impact of this shift for beginners is the change from bounce rate to engagement rate. In Universal Analytics, a high bounce rate looked bad. In GA4, engagement rate measures whether users had at least one meaningful interaction or spent more than 10 seconds on the page. It is a more honest reflection of whether your content is actually useful.
4 Is Google Analytics Free: And What Are the Limits
Yes. Google Analytics 4 is completely free for the vast majority of websites.
The free version of GA4 gives you access to all standard reports, real-time data, audience analysis, conversion tracking, Google Search Console integration, Google Ads integration, and the Explore custom reporting section. For a personal brand blog, small business website, or even a mid-sized ecommerce store, the free version covers everything you will ever need.
There is a paid enterprise version called Google Analytics 360, which is designed for large organisations processing hundreds of millions of events per month. It costs significantly more and provides higher data processing limits, more granular data controls, and dedicated support. For the audience reading this guide, Google Analytics 360 is not relevant or necessary.
The only meaningful limitation of the free GA4 version is data retention. By default, GA4 stores event-level data for only two months. You can extend this to 14 months in your Admin settings, and I strongly recommend doing this the moment you set up your account. Go to Admin, then Data Settings, then Data Retention, and change the setting to 14 months. This takes 30 seconds and ensures you can compare year-over-year data inside GA4 when you need it.
5 How to Set Up Google Analytics 4 on Your WordPress Website
Setting up GA4 correctly from the start saves you from data gaps and configuration errors that are frustrating to fix later. Here is the complete setup process for a WordPress website:
Step 1: Create your Google Analytics account.
Go to analytics.google.com and sign in with your Google account. Click Start Measuring and follow the prompts to create an account name (your business or website name), a property name (your website URL), and set your time zone and currency to match your target market.
Step 2: Set up your data stream.
After creating your property, GA4 will prompt you to set up a data stream. Choose Web, enter your website URL, and give the stream a name. Leave Enhanced Measurement turned on. This automatically tracks scrolls, outbound clicks, video plays, file downloads, and site search without any extra configuration.
Step 3: Install the tracking code on WordPress.
The easiest method for WordPress websites is to use the Google Site Kit plugin, which is free, official, and connects GA4 to your site in under five minutes without touching any code. Install Site Kit from the WordPress plugin directory, activate it, and follow the setup wizard to connect your Google account. Site Kit also connects Google Search Console in the same process, which is important for the SEO use cases covered later in this guide.
Step 4: Verify GA4 is receiving data.
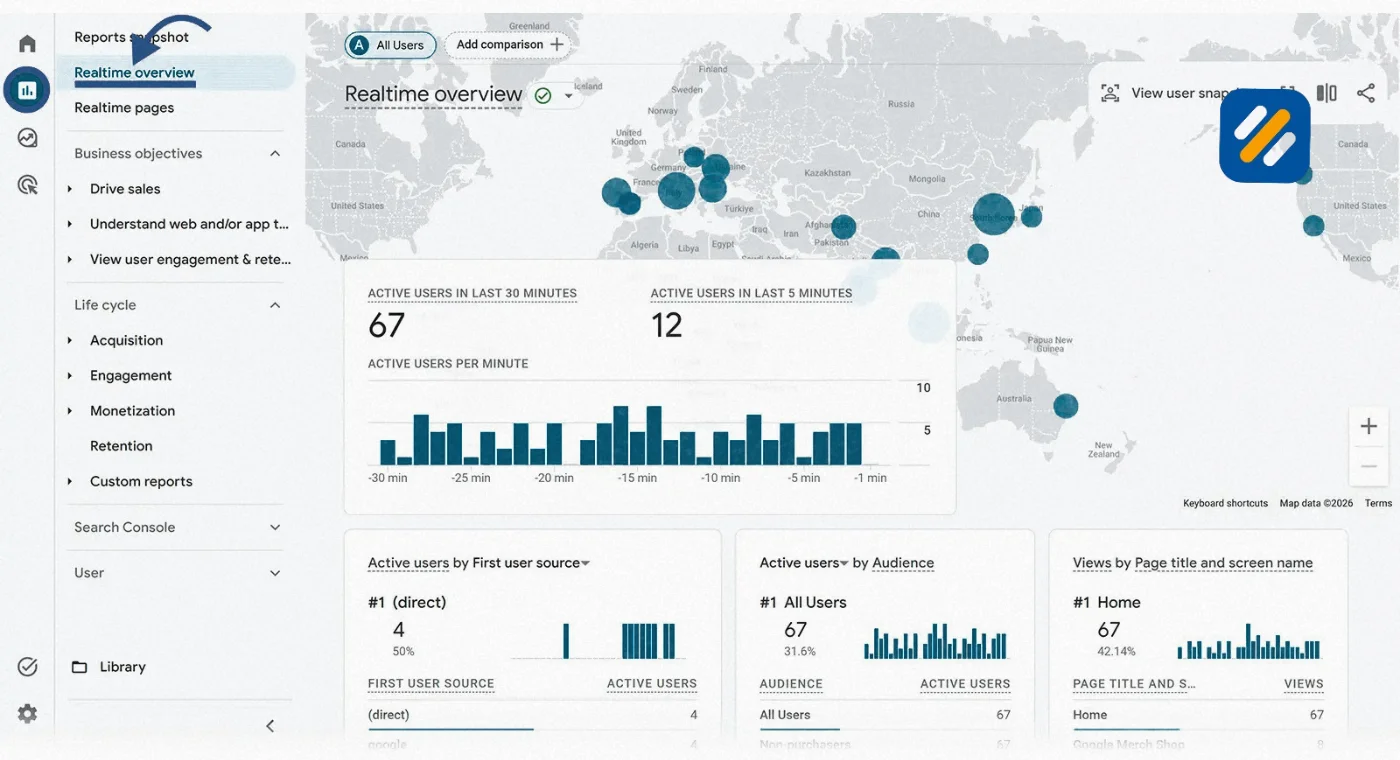
After installing the tracking code, open GA4 and navigate to Reports then Real-time. Open your website in a separate browser tab. If GA4 is correctly installed, you will see your own visit appear in the Real-time report within 30 seconds. This confirms data is flowing correctly.
Step 5: Extend data retention to 14 months.
Go to Admin, then Data Settings, then Data Retention, and change User and event data retention from 2 months to 14 months. Click Save.
Step 6: Connect Google Search Console.
In your GA4 Admin panel, scroll down to Product Links and click Search Console Links. Follow the prompts to connect your verified Search Console property. This adds a Search Console section to your GA4 Reports where you can see which keywords are driving organic traffic alongside how users behave after they arrive from those searches.
6 The Google Analytics Dashboard Explained | What Everything Means
The GA4 interface looks very different from Universal Analytics when you first log in. Here is a plain English explanation of every main section:
Home is your default landing page. It shows a summary of users, sessions, conversions, and event counts for the last seven days. Think of it as your morning dashboard check.
Reports is where most of your analysis happens. It breaks down into several subsections:
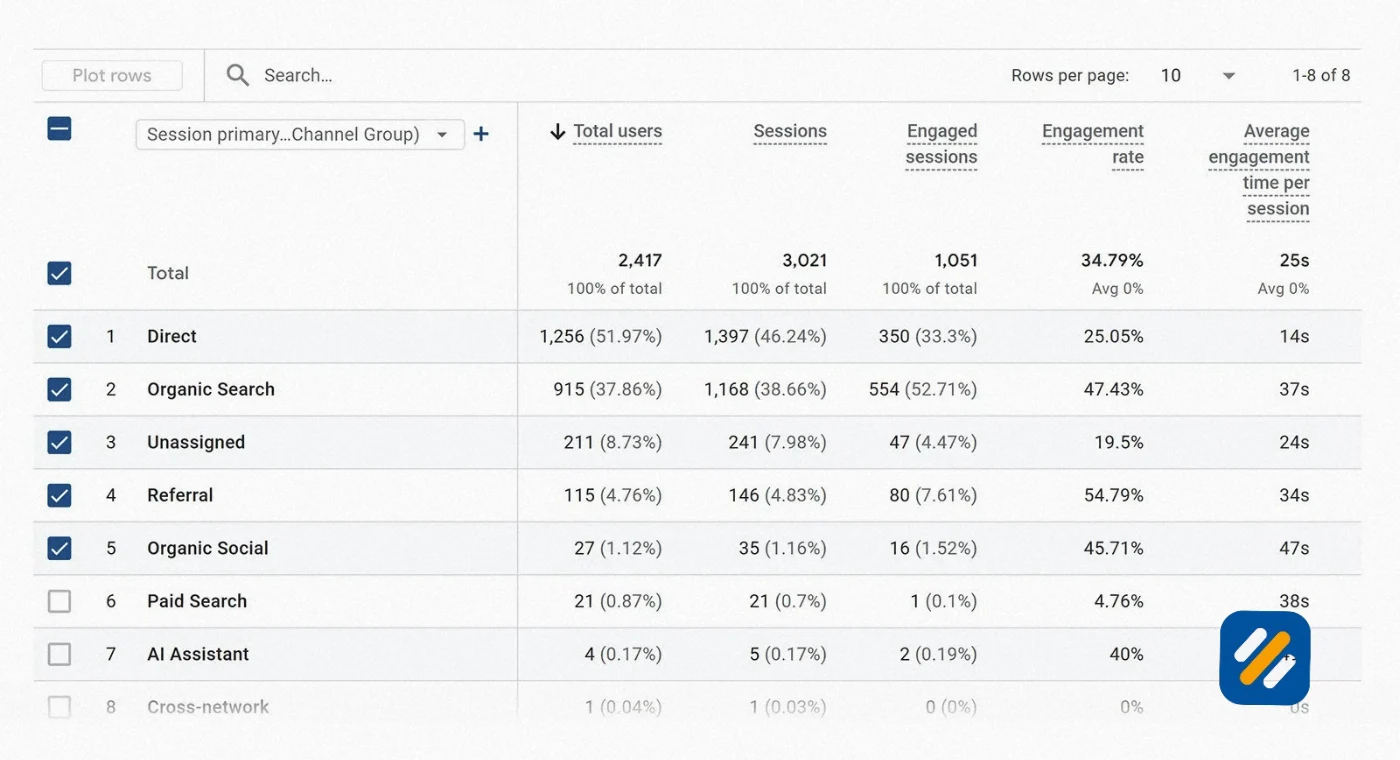
The Acquisition section shows where your traffic comes from. Organic Search, Direct, Referral, Social, and Paid Search are the main channels. For SEO work this is your first stop every week. A growing Organic Search line means your SEO is working. A flat or declining line means something needs attention.
The Engagement section shows what users do after they arrive. You can see which pages get the most views, which events fire most frequently, and which landing pages generate the most engaged sessions.
The Monetisation section is for ecommerce websites and shows revenue, purchase journeys, and product performance.
The Retention section shows how many users come back after their first visit. Strong retention signals that your content is building a repeat audience.
Explore is where GA4 becomes genuinely powerful. This section lets you build custom reports from scratch using any combination of dimensions and metrics GA4 collects. You can build funnel visualisations, path explorations showing how users navigate between pages, and segment overlap reports comparing different audience groups.
Advertising shows attribution data when you have Google Ads connected, helping you understand which campaigns and keywords drive conversions.
7 How to Use Google Analytics for SEO | The Reports That Actually Matter
GA4 and SEO work together in ways that most beginners do not fully use. Here is how to extract real SEO value from your analytics data:
Organic traffic trend analysis: Go to Reports then Acquisition then Traffic Acquisition and filter by Session default channel group equals Organic Search. This shows you the trend of your organic traffic over any time period. Compare month over month and year over year to understand whether your SEO strategy is gaining momentum.
Landing page performance: Go to Reports then Engagement then Landing Page. Filter by Organic Search traffic to see which pages are bringing in the most visitors from Google. Pages with high organic sessions but low engagement rate are candidates for a content update. Pages with high engagement but low session counts are candidates for stronger internal linking and promotion.
Search Console keyword data: After connecting Search Console, go to Reports then Search Console then Queries. This shows you every keyword bringing organic traffic to your site along with clicks, impressions, click-through rate, and average position. Keywords ranking between positions 5 and 15 with reasonable impression counts are your priority optimisation targets. A small improvement in position can deliver a significant increase in clicks.
Page-level user behaviour: Select any page in the Landing Page report and click through to see the engagement metrics specific to that page. Engagement rate, average engagement time, and conversions from that page tell you whether your content is serving its purpose or needs improvement.
8 Google Analytics for SEO | Key Metrics Every Blogger Should Track Weekly
| Metric | Where to Find It in GA4 | What It Tells You | Good Benchmark |
|---|---|---|---|
| Organic sessions | Traffic Acquisition report | How much traffic is coming from Google | Growing month over month |
| Engagement rate | Any traffic report | Percentage of sessions with real interaction | Above 50% is healthy |
| Average engagement time | Engagement overview | How long users spend actively on your site | Above 1 minute for blog content |
| Top landing pages | Landing Page report | Which pages bring in the most visitors | Your best pages to update and promote |
| Organic keywords | Search Console Queries | Which search terms send you traffic | Growing keyword count over time |
| Conversions | Engagement then Conversions | How many users complete your defined goals | Growing month over month |
| New vs returning users | Retention report | Whether your audience is building loyalty | At least 20% returning users |
| Traffic by channel | Traffic Acquisition | Balance between organic, direct, social, referral | Organic should be growing share |
Check these eight metrics once per week. The whole review takes under fifteen minutes once you know where to look. More importantly, you will notice problems early. A sudden drop in organic sessions in one week is a red flag to investigate immediately rather than discover six weeks later.
9 Google Analytics Alternatives | Are There Better Free Options
Google Analytics 4 is the most powerful free analytics tool available. But it is not the only option, and for some website owners, the alternatives are worth considering.
Plausible Analytics is a privacy-focused alternative that is simpler to use and fully GDPR compliant without cookie consent banners. It is not free but starts at a low monthly cost. The trade-off is significantly less data depth compared to GA4.
Matomo is an open-source analytics platform you can self-host for free. It gives you complete control over your data, which is important for certain industries and regions. The interface is closer to Universal Analytics, which makes it familiar for people who miss the old Google Analytics setup.
Fathom Analytics is another privacy-first option that is extremely simple to set up and read. Like Plausible it has a monthly cost but the data is clean, GDPR compliant, and does not require cookie consent.
For the vast majority of small business owners and bloggers, GA4 is the right choice. It is free, the most feature-rich, and integrates directly with every other Google tool you will use. The learning curve is real but the investment in understanding GA4 pays back every time you use the data to make a better decision.
10 3 Expert Tips to Get More From Google Analytics
Tip 1: Set up at least one conversion event in your first week.
Most beginners install GA4 and never define a conversion. Without conversions, you cannot measure what your traffic is actually worth. Even a simple conversion like a contact form submission or a newsletter signup gives your data meaning. Go to Admin then Events and mark any event as a conversion by toggling it on. This takes two minutes and changes GA4 from a traffic counter into a business measurement tool.
Tip 2: Use the Explore section to find your highest-value content.
The standard reports show you your most-visited pages. The Explore section lets you find your most valuable pages. Build a free-form exploration report that combines organic sessions, engagement rate, average engagement time, and conversions by landing page. Sort by conversions. The pages at the top of that list deserve more internal links, more updates, and more promotion. These are the pages actively working for your business right now.
Tip 3: Compare date ranges to spot real trends rather than daily noise.
Single-day traffic numbers are almost meaningless for strategic decisions. Daily traffic fluctuates for dozens of reasons. Instead, use GA4's date comparison feature to compare this month versus last month, or this quarter versus the same quarter last year. These comparisons reveal genuine trends rather than daily noise. Go to any report, click the date picker, and enable the Compare option to see period-over-period changes in every metric.
11 Conclusion
Google Analytics 4 is the most important free tool a website owner can set up. It is the difference between guessing why your website is or is not growing and knowing exactly what is happening, where it is happening, and what to do about it.
The setup takes less than an hour. The data it gives you will inform every SEO decision, every content decision, and every marketing decision you make for as long as your website exists.
If you have not set up GA4 yet, do it today. If you have it installed but never really look at it, start with the eight metrics in the table above and check them once per week. Within three months you will notice patterns that change how you think about your website.
Have a question about setting up or using Google Analytics 4? Drop it in the comments below and I will answer it personally.
Join 1,000+ business owners and bloggers who get one actionable SEO tip every week — straight to their inbox. Free forever.
Get Free Weekly Tips →